Pareto Principle - 80/20 Rule
How To Benefit From The Fat Tail Fractal Factor
Less Than 1% Of Your Resources Will Deliver Over 50% Of The Results
The Pareto Principle - Overview
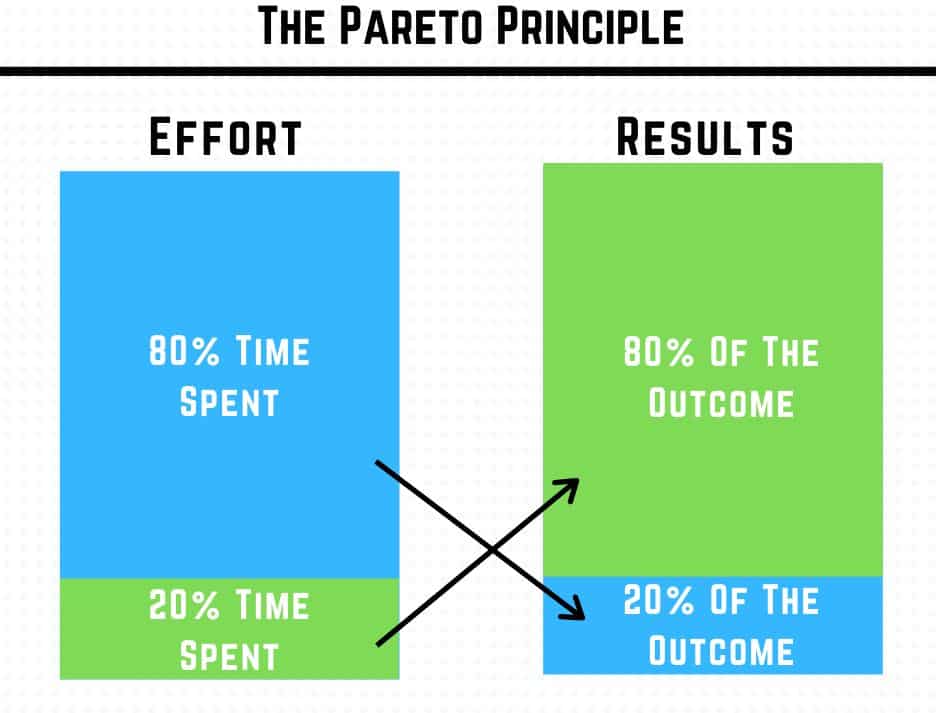
The Pareto Principle, also known as the 80/20 Rule, and sometimes known as "The Law of the Vital Few and The Useful Many", illustrates that 80% of effects arise from 20% of the causes.
This means that causes of an outcome can be divided into two categories:
- The vital few: A small number of causes that account for most of the outcomes.
- The useful many: The large number of remaining causes that individually and collectively account for a relatively small part of the entire outcome.
In practical terms: 20% of your actions/activities will account for 80% of your results/outcomes.
The Pareto Principle gets its name from the Italian-born economist Vilfredo Pareto (1848-1923), who observed that a relative few people held the majority of the wealth (20%) – back in 1895.
The Pareto Principle is an observation, not a law of nature
- It is a generally applicable observation about the imbalance of inputs and outputs.
- The 80% and 20% are just indicators. It’s a misconception that the numbers should always be around 80 and 20. They do not necessarily need to be, these numbers are just a guide.
- The point is the imbalance, the inequality and not the ratio.
- The key purpose of this observation is to prompt you to find the small things that give you the biggest results - i.e. the point of maximum leverage
- The Pareto Principle is a model and a tool to enable you to work smarter and prioritize the right things in order to deliver better results and value.
80/20 Rule Examples
- 80% of problems originate from 20% of projects
- 60% of your distractions come from 40% of sources
- 70% of customers only use 30% of product features
- 90% of complaints are made by 10% of users
- 80% of value is achieved with the first 20% of effort
- 85% of the important conversations are from 15% of the emails
Steps to apply the 80/20 Rule
- Identify all your daily/weekly tasks
- Identify key tasks
- What are the tasks that give you more return?
- Brainstorm how you can reduce or transfer the tasks that give you less return
- Create a plan to do more that brings you more value
- Use 80/20 to prioritize any project you’re working on
- Set a plan to focus on activities that produce the most result
How to set goals based on the 80/20 Rule
[1] Identify your key tasks based on your goals
- What’s
blocking you?
- Make a list of your constraints.
- What’s standing in the way of your priorities?
[2] Clarify and unblock
- More clarity will help you have a better vision of your goals and what you need to do in order to achieve those goals.
- Removing impediments enables you to improve focus on tasks that will give you more return.
[3] Work smarter
- The Pareto Principle should be a constant basis in your personal and working life.
- Evaluate,
prioritize, focus, and continuously work
smarter.
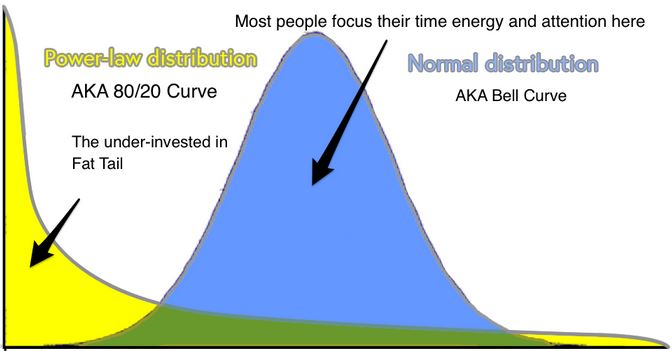
The graph above illustrates and compares the bell curve of standard distribution and the 80/20 curve of power law distribution. The
Bell Curve is the distribution model that most of us are familiar with
and it is fairly accurate way to describe simple systems. It works
best where the range of variation - the variation from the mean
[average] - is not that great. A good example of this is the height of
people. If we take the average height of a woman as 163 cm or 1.6 meters
or, as expressed in imperial measure, 5 feet 3 inches the range of
variation is going to fall within 91 cm and 213 cm, or 3 feet and 7
feet. In this standard distribution, the height of most women
will lie in the middle of the bell curve and the height of the smallest
and highest will trail out slightly to each side of the bell. The 80/20 Curve - Power Law Distribution However
when you are dealing with statistics where the range of variation - the
variation from the mean [average] - is large then the 80/20 Curve is
the appropriate model. It is referred to as a "Power Law Distribution". Put simply [as a non statistician I can only only see these things simply]: A power law describes a relationship between two things in which a change in one thing can
lead to a large change in the other, regardless of the initial
quantities. A good example
of this is income. If we assume the global average annual income per
person is $18,000 the range of variation from the average figure is
colossal. Taken at the country level, India has an average per capita income of $1,700 whereas Monaco has an average per capita income of $180,700. At the individual level the range is extreme.
Just for the purpose of this illustration, if we take the lowest
individual annual income from India as $1,700 per annum, on the highest end of the income spectrum there are a small number [1%] of individuals making an annual income of $500,000 per annum and even smaller number making over $50million per annum. The Long Tail In the
graphic above, the long tail is the section to the right coloured green
which commences at the point where the Bell Curve intersects the 80/20
curve. The statistical term long tail is a pattern of distribution that occurs
when a larger share of occurrences occur farther away from the mean or average value.Pareto Principal and The Fat Tail

The Bell Curve - Standard Distribution
The Fat Tail
In the graphic above, the fat tail is the section coloured yellow to the left of the point where the Bell Curve intersects the 80/20 curve.
The statistical term 'fat tails' refers to probability distributions with relatively high probability of extreme outcomes.
Resource
For a fuller, and relatively easy to read, explanation of the dynamics of Power Laws I recommend Shane Parrish's excellent article:
Power Laws: How Nonlinear Relationships Amplify Results
It's Now The 80/20 Curve That Defines Our Lives
From this point onward in this article I am deeply indebted to Taylor Pearson:
"...as our world grows more complex and interdependent, the bell curve is a worse and worse way of describing the things that matter to us.
It’s now
the 80/20 curve that defines our lives. The statistical term 'fat
tails' refers to probability distributions with relatively high
probability of extreme outcomes.
80/20 is striking to most people because it indicates that the natural order of most systems is not an equal distribution, but an unequal distribution: only 20% of customers account for 80% of revenue."
However, the disparities are even larger than most people think.
The really striking part is just how concentrated the “fat tail” of the curve is.
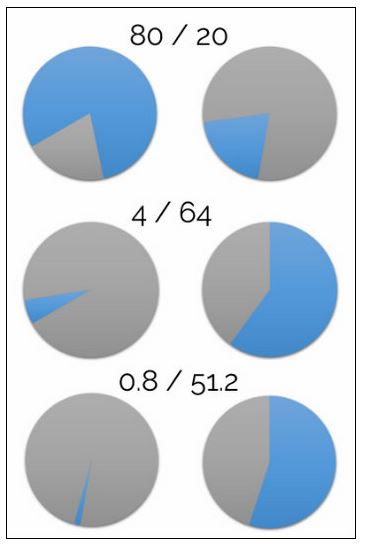
Jesus Marketing [Taylor Pearson] Why is the Fat Tail so concentrated? Because the 80/20 is fractal, meaning it can be applied to itself. If 20% of people own 80% of the land, we
can then take the 80/20 of that new 20%. In that case, 4% of people
would own 64% of the land. If we then took the 80/20 of that, then 0.8% of people own 51.2% of the land. That’s really concentrated! And this is true everywhere. We tend to spend most of our time and energy thinking about the middle,
because we see the world through a bell curve lens, and most of the
area in a bell curve is in the middle. But in reality, we live in an
80/20 world. The Top 1% Of Fat Tails Account For 50% Of The Results
Taylor Pearson says: "A good rule of thumb for identifying the fat tail in any given system is to think about how to go deep, not wide. A
key reason why all the margin is in the fat tails is because there is
no clear cause and effect. The fat tails are profitable in part because
they are hard to directly attribute. It’s almost impossible to measure depth, but easy to measure breadth. In
relationships, the number of Facebook friends you have is easy to
measure, but that number is a horrible metric of anything meaningful.
You can have tons of FB friends and feel terribly lonely. Most people
do. In marketing, it’s easy to measure how many contacts are in your database, but hard to measure how much the top 1% are worth. In books, it’s easy to measure how many books you’ve read, but really hard to measure how much a book impacted your thinking." Investing
more in fat tails means being wrong a lot more, and perhaps this is why
the most successful people often say they made a lot of mistakes. They
made a lot of fat tail investments, most didn’t pay off, but the ones
that did make all the difference. Resources Taylor Pearson: 4 Strategies To Find The Work Only You Can Do (And Why It’s More Profitable Than Ever) Further Reading: Applying The Fat Tail Fractal Factor Return from "Pareto Principle" to: Mental ModelsHow To Benefit From The Fat Tail Fractal Factor?

Focus on depth, not breadth
LATEST ARTICLES
The Inner Weight of Shame - Sustained By Attentional Fixation
 A Mind That Is Continuously Engaged In Self-Surveillance. Shame is one of the heaviest inner burdens a human being can carry. It does not announce itself loudly or demand attention through drama. Inst…
Does Prayer Work? The Psychology of Prayer, Meditation and Outcomes
 Reality Is A Complex System Of Countless Interactions - Including Yours. So does prayer work? The problem is that the question itself is usually framed in a way that guarantees confusion. We tend to a…
Living in Survival Mode Without Surrendering Mental Authority
Living in Survival Mode Without Surrendering Mental Authority
 Clear Thinking When You’re Just Trying to Stay Afloat. Many people today are overwhelmed because they are living in survival mode - not temporarily, but as a persistent condition of life. For many, th…
Manifestation Without Magic: A Practical Model
 Manifestation without magic is not a softer or more intellectual version of popular manifestation culture. It is a different model altogether. Popular manifestation teachings tend to frame reality as…
Staying Committed When You Can't See Progress - The Psychology of Grit
 Uncertainty Is Not The Absence Of Progress, Only The Absence Of Reassurance. One of the most destabilising experiences in modern life is not failure, but uncertainty and staying committed when you can…
The Battle For Your Mind - How To Win Inner Freedom In A Digital Age Of Distraction
 From External Events to Inner Events. We often think of “events” as things that happen out there: the traffic jam, the rude comment, the delayed email reply. But what truly shapes our experience is wh…
How to See Your Thoughts Without Becoming the Story
 A Practical Guide to Thought-Awareness. You can spend your life inside the stories of your mind without ever learning how to see your thoughts clearly and objectively. Most of the stuff we tell oursel…
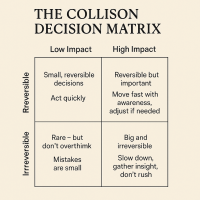
The Collison Decision Matrix - A Simple Framework for Better Choices
 The Collison Decision Matrix Is A Practical Everyday Thinking Tool. Most of us spend a surprising amount of time worrying about decisions. From small ones such as what to wear, what to eat, what to te…
The Power Of Asking The Right Question
 The Power Of Asking The Right Question Lies In The Quest For Insight. To experience the power of asking the right question you must develop the practice of asking questions. The best way to improve th…
Site Pathways
 Here is a site pathway to help new readers of Zen-Tools navigate the material on this site. Each pathway is based around one of the many key themes covered on this site and contain a 150 word introduc…
How To Live With Contradiction - Beyond Thought Let Stillness Speak
 A major impact on so many peoples' lives is the situational contradiction of unfilled realistic expectations. So where does all this leave us? Well here we are, with mental equipment that is more lim…
